Blackwells (paperbacks for European customers)
Bulk orders
(5+ copies)
Are you an influencer? Contact us to request reviewer copies of Practical Charts + More Practical Charts.
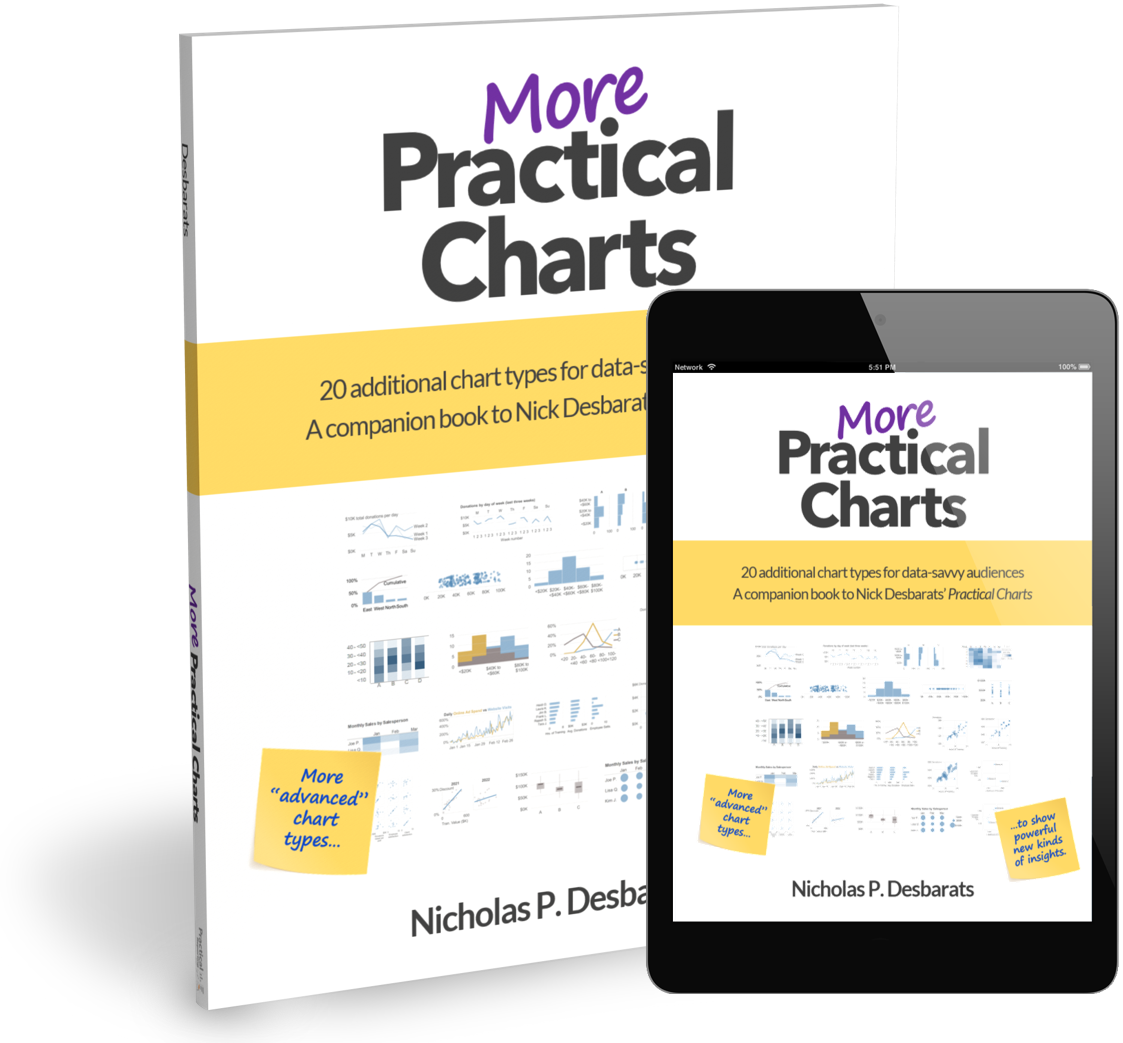
20 additional chart types for data-savvy audiences
Optional companion book to Practical Charts
More “advanced” chart types to show powerful new kinds of insights
Get this book for free with the…
Practical Charts On Demand course
6.5 hours of video in 45 lessons
In Practical Charts, you learned about 30 essential chart types. More Practical Charts adds 20 additional, “advanced” chart types that…
Can show powerful insights that aren’t possible to show using more common chart types.
Can be shown to audiences with more technical or scientific backgrounds (but that audiences with average levels of data savviness might struggle to understand).
Are commonly used in technical or scientific contexts, but rarely used in content that’s targeted at a general audience.
Chart types covered in More Practical Charts:
Pareto charts
Heatmaps
Shape size charts
Overlapping cycles charts
Cyclical heatmaps
Cycle plots
Strip plots
Jittered strip plots
Merged strip plots
Histograms
Box plots
Merged histograms
Overlapping histograms
Distribution line charts
Distribution heatmaps
Merged bar charts
Scatter plots
Colored-dot scatter plots
Bubble charts
Scatter plot matrices
-
This book is an optional companion to Practical Charts and isn’t intended to be read on its own. If you haven’t read Practical Charts yet, go read that one first, then come back and read this one.
-
In Practical Charts, you saw about 30 “essential” chart types that…
1) Anyone who creates charts as part of their work should be aware of and understand when to use.
2) Are, for the most part, familiar to audiences with “average” levels of data savviness, such as non-technical decision-makers.
3) You might see in articles, presentations, books, etc., that are targeted at a general audience.
This book covers an additional 20 or so “advanced” chart types that…
1) Might not be familiar to audiences with an average level of data savviness, who will likely require explanations to understand how to read them and who might struggle to understand those chart types, even with explanations.
2) Might already be familiar to audiences with technical or scientific backgrounds.
3) Generally aren’t used in content that’s intended for a general audience, but are used regularly in technical or scientific articles, presentations, reports, and the like.
-
Many chart creators can't use these chart types because their audience would struggle too much to grasp them, or simply wouldn't be able to grasp them. I (Nick) didn't want to force chart creators to buy and read content from me that they'll never use in practice, so I packaged that content as an optional companion book.
-
More Practical Charts is organized into five chapters:
Chapter 1: Pareto charts
Chapter 2: Heatmaps and shape size charts
Chapter 3: Showing cyclical (e.g., seasonal) time series data
Includes overlapping cycles charts, heatmaps (for showing cyclical time series), and cycle plots.Chapter 4: Showing how values are distributed across a range
Includes strip plots, jittered strip plots, histograms, merged strip plots, merged jittered strip plots, merged histograms, overlapping histograms, distribution line charts, distribution heatmaps, box plots (not recommended), formatting interval scales, useful enhancements for distribution charts, and showing distributions changing over time.Chapter 5: Showing how variables are related
Includes merged bar charts (for showing correlation), scatter plots, showing different categories of items, showing correlations changing over time, showing relationships among three variables, “colored-dot” scatter plots, bubble charts, showing relationships among more than three variables, “item-comparison” scatter plots, showing item comparisons changing over time, and inset charts (in correlation charts). -
The Practical Charts and More Practical Charts books are based on Nick Desbarats’ Practical Charts course. The Practical Charts course is available as a pre-recorded, on-demand course, and Nick regularly delivers live, private workshops for 15 to 60 employees of the same organization, and live open-registration workshops approximately three times a year. For more information on taking the Practical Charts course, please click the links above or contact us.
-
Interested in purchasing five or more copies of More Practical Charts for your team or organization? We offer discounts on bulk book purchases.
For information on booking Nick to deliver a private Practical Charts online or in-person workshop for your team, please contact us.
-
Contact us to request a complementary desk copy and for information about educational discounts.
-
Missing pages? Poor color quality? Other weird problems? Unfortunately, you may have a counterfeit (fake) copy of More Practical Charts (argh). How to verify if your copy is genuine.


