
This might come as a bit of a shock, but data on dashboards can be wrong. I KNOW! While data quality problems are often hard to detect, sometimes, they’re blatantly obvious. An “Average Customer Satisfaction Rating” of 12.5 on 10. A “Manufacturing Defect Rate” of -14%. A “Current Headcount” of 0.
Unfortunately, most dashboards display obviously wrong values such as these without any indication that anything’s amiss. Imagine being a dashboard user and seeing “Average Customer Satisfaction Rating: 12.5/10” among the metrics on a dashboard, though. What’s going through your head? Probably something like, “Man, if no one on the data team noticed such an obvious error, what ELSE is wrong on this dashboard?” It puts the accuracy of every other value on the dashboard into question, now and probably for quite some time in the future. It’s already hard enough to earn users’ trust when it comes to the accuracy of the data on our dashboards and incidents like these set us way, way back. After even just a few such incidents, users may simply stop using the dashboard altogether. Why use information that clearly hasn’t been subjected to even basic quality checks and that contains obvious errors?
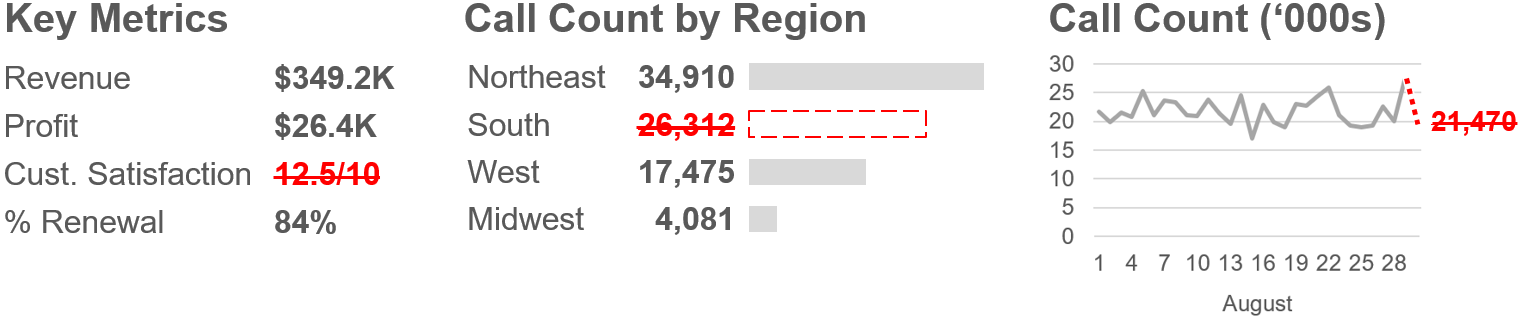
What can we do, though, right? Errors are gonna happen. Well, in my Practical Dashboards course, I recommend adding simple business logic to dashboards to test whether metric values are obviously wrong, and to visually flag them if they are, like this:
By visually flagging obviously wrong values, we provide at least some reassurance to users by showing them that we are doing basic quality checking, that we’ve noticed the error, and that we’re (hopefully) working on it. Obviously, it’s still not great when users see something like this on a dashboard, but it’s far better than users spotting an obviously wrong value themselves without any indication that the data team noticed such an obvious problem.
In the Practical Dashboards course, I discuss several types of tests that we can use to detect “obviously wrong” metric values. The more of these that our dashboards support, the better:
Value not in realistic range
For most metrics, we have a good idea of what’s realistically possible. If Daily Revenue is almost always between $50K and $200K, we should flag it as obviously wrong if it ever falls outside of, say, $0 to $1M. If “Average Customer Satisfaction” isn’t a positive float value between 0 and 10, it should get flagged.
Metric not updated as expected
A more pernicious type of “obviously wrong” problem occurs when a metric’s value hasn’t been updated as expected and so no value exists for the current period. Unfortunately, when this happens, many dashboard development products will start looking back through time until they find a value for that metric and then display that out-of-date, obsolete value without any kind of warning to users, who then have no idea that they’re looking at old data. This can obviously lead to very bad decision-making.
Note that, in order to detect “not updated as expected” problems, the dashboard needs to “know” the expected update schedule for each metric, so there’s work involved here. Hopefully, though, I’m convincing you that this is work that’s worth doing.
Input values not in realistic range or not updated as expected
For calculated metrics that are the sum, average, etc. of a set of input values (i.e., most metrics), we should test all of the input values, as well. If even one single input value is obviously wrong, the final calculated metric must also be flagged as obviously wrong until every obviously wrong input value is corrected.
Higher/lower than other, related metrics
Profit must never be higher than Revenue. Payroll Expenses must never be higher than Total Expenses. The more of these “higher/lower” rules that our dashboard “knows”, the better it will be at catching and flagging obviously wrong metrics. The number of such rules is potentially large, so maybe start with rules for metrics that you suspect may be more prone to errors. Note that, if a “higher/lower” rule is violated, BOTH metric values must be flagged as obviously wrong until it’s determined which one is actually wrong.
In situations where we have a bit of time between when we receive updated values and when we need to show users an updated dashboard, “obviously wrong” tests can alert the data team to errors and give them a chance to investigate and correct them before users see them on the dashboard, which is even better, of course.
Sometimes, I get pushback from workshop participants who aren’t comfortable drawing attention to errors that, in certain cases, could be their fault. What looks worse, though: A mistake that a user notices that your dashboard didn’t catch, or one that they notice but that is visually flagged? There’s also an ethical consideration, of course. If we deliberately avoid checking for obviously wrong values because we don’t want to look bad, we’re knowingly exposing our organization to potential harm in the form of bad decisions that were made because of bad data.
Others have suggested simply not showing obviously wrong values at all, or replacing them with a message such as “Pending…”. You could opt to do that but, often, the “obviously wrong” value is still meaningful. For example, if the Revenue number for the most recent day hasn’t been updated as expected, the number from the day before still gives a ballpark idea of what it might be. Forcing users to wait for investigations to be completed to see any value at all could cause harm, as well…
By the way…
If you’re interested in attending my Practical Charts or Practical Dashboards course, here’s a list of my upcoming open-registration workshops.